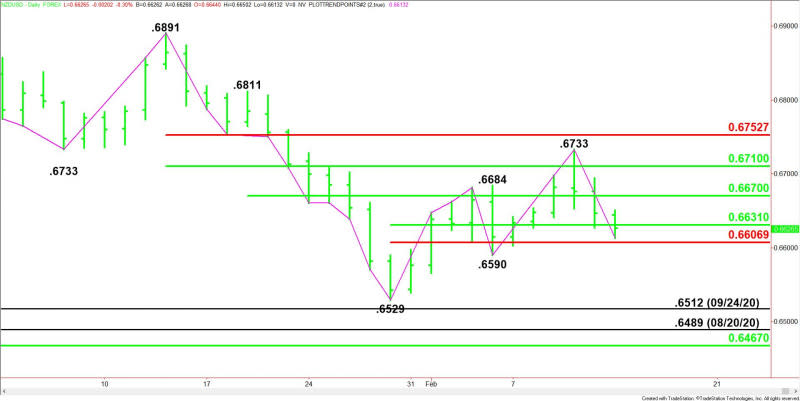
NZD/USD Reaction to .6631 – .6607 Sets the Tone
The New Zealand Dollar is trading lower for a third session early Monday as political concerns over Ukraine offset further gains in global commodity prices as inflation becomes more broad-based.
The Kiwi risks remain skewed to the downside, however, traders aren’t expecting a substantial decline ahead of next week’s Reserve Bank’s (RBNZ) widely expected interest rate hike.
At 06:45 GMT, the NZD/USD is trading .6627, down 0.0020 or -0.30%.
Recent data showed a surge in domestic inflation, which is contributing to the talk that the RBNZ might hike by 50 basis points later this month, though the central bank has said it favors gradual tightening.
Nonetheless, the wildcard is if or when Russia invades Ukraine. This move could rattle the financial markets with the New Zealand Dollar likely to tumble as investors move funds into the safe-haven U.S. Dollar.
Daily Swing Chart Technical Analysis
The main trend is up according to the daily swing chart, however, momentum is trending lower.
A trade through .6590 will change the main trend to down. A move through .6733 will signal a resumption of the uptrend.
The short-term range is .6529 to .6733. The NZD/USD is currently testing its retracement zone at .6631 to .6607.
On the upside, the nearest resistance is a 50% level at .6670, followed by a retracement zone at .6710 to .6753.
Daily Swing Chart Technical Forecast
The direction of the NZD/USD on Monday is likely to be determined by trader reaction to .6631 to .6607.
Bullish Scenario
A sustained move over .6631 will indicate the return of buyers. The first target is .6670.
Sellers could come in on the first test of .6670, but if buyers can overcome this level then look for a potential retest of .6710 to .6753. This area stopped the rally at .6733 last Thursday.
Bearish Scenario
A sustained move under .6607 will signal the presence of sellers. This could trigger a quick break into the main bottom at .6590.
Taking out .6590 will change the main trend to down. This could trigger an acceleration into the next main bottom at .6529.
For a look at all of today’s economic events, check out our economic calendar.
This article was originally posted on FX Empire