Installed Building Products (NYSE:IBP) Misses Q2 Revenue Estimates

Building products installation services company Installed Building Products (NYSE:IBP) fell short of analysts' expectations in Q2 CY2024, with revenue up 6.6% year on year to $737.6 million. It made a non-GAAP profit of $3.02 per share, improving from its profit of $2.62 per share in the same quarter last year.
Is now the time to buy Installed Building Products? Find out in our full research report.
Installed Building Products (IBP) Q2 CY2024 Highlights:
Revenue: $737.6 million vs analyst estimates of $745 million (small miss)
Adjusted EBITDA: $129.8 million vs analyst estimates of $133.0 million (2.4% miss)
EPS (non-GAAP): $3.02 vs analyst estimates of $2.88 (4.7% beat)
Gross Margin (GAAP): 34.1%, up from 33.6% in the same quarter last year
Free Cash Flow of $58.2 million, similar to the previous quarter
Market Capitalization: $7.65 billion
“IBP reported another strong quarter of growth and profitability highlighting the value our talented and committed teams provide to our residential and commercial customers. Growth across our core end markets remained positive during the second quarter as builders continued to meet new construction home demand, helping IBP achieve another quarter of record sales and earnings,” stated Jeff Edwards, Chairman and Chief Executive Officer.
Founded in 1977, Installed Building Products (NYSE:IBP) is a company specializing in the installation of insulation, waterproofing, and other complementary building products for residential and commercial construction.
Home Builders
Traditionally, homebuilders have built competitive advantages with economies of scale that lead to advantaged purchasing and brand recognition among consumers. Aesthetic trends have always been important in the space, but more recently, energy efficiency and conservation are driving innovation. However, these companies are still at the whim of the macro, specifically interest rates that heavily impact new and existing home sales. In fact, homebuilders are one of the most cyclical subsectors within industrials.
Sales Growth
Reviewing a company's long-term performance can reveal insights into its business quality. Any business can have short-term success, but a top-tier one tends to sustain growth for years. Over the last five years, Installed Building Products grew its sales at an incredible 15.1% compounded annual growth rate. This is a great starting point for our analysis because it shows Installed Building Products's offerings resonate with customers.
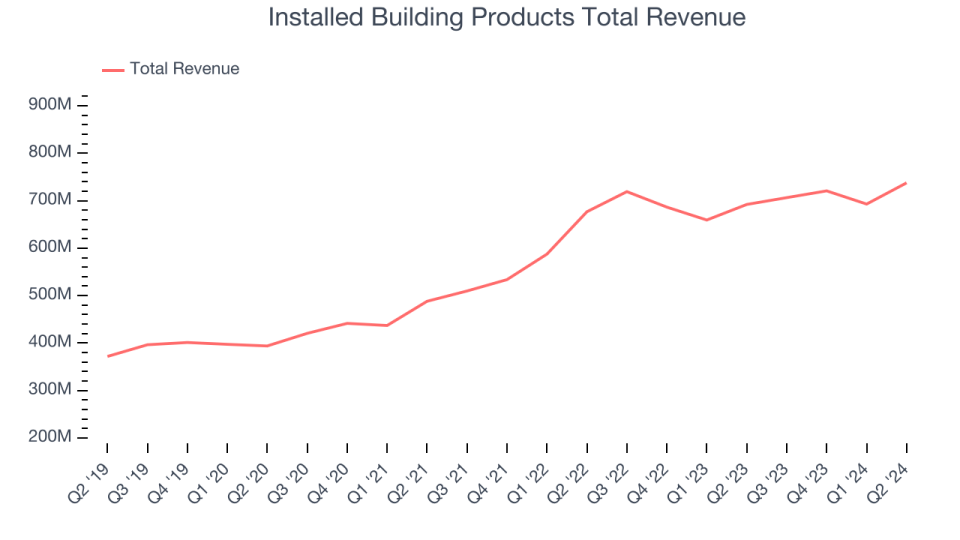
Long-term growth is the most important, but within industrials, a half-decade historical view may miss new industry trends or demand cycles. Installed Building Products's annualized revenue growth of 11.3% over the last two years is below its five-year trend, but we still think the results were good and suggest demand was strong.
This quarter, Installed Building Products's revenue grew 6.6% year on year to $737.6 million, missing Wall Street's estimates. Looking ahead, Wall Street expects sales to grow 7.9% over the next 12 months, an acceleration from this quarter.
Here at StockStory, we certainly understand the potential of thematic investing. Diverse winners from Microsoft (MSFT) to Alphabet (GOOG), Coca-Cola (KO) to Monster Beverage (MNST) could all have been identified as promising growth stories with a megatrend driving the growth. So, in that spirit, we’ve identified a relatively under-the-radar profitable growth stock benefitting from the rise of AI, available to you FREE via this link.
Operating Margin
Operating margin is an important measure of profitability as it shows the portion of revenue left after accounting for all core expenses–everything from the cost of goods sold to advertising and wages. It's also useful for comparing profitability across companies with different levels of debt and tax rates because it excludes interest and taxes.
Installed Building Products has managed its expenses well over the last five years. It demonstrated solid profitability for an industrials business, producing an average operating margin of 11.7%.
Analyzing the trend in its profitability, Installed Building Products's annual operating margin rose by 4.3 percentage points over the last five years, as its sales growth gave it operating leverage.

This quarter, Installed Building Products generated an operating profit margin of 12.9%, in line with the same quarter last year. This indicates the company's cost structure has recently been stable.
EPS
We track the long-term growth in earnings per share (EPS) for the same reason as long-term revenue growth. Compared to revenue, however, EPS highlights whether a company's growth was profitable.
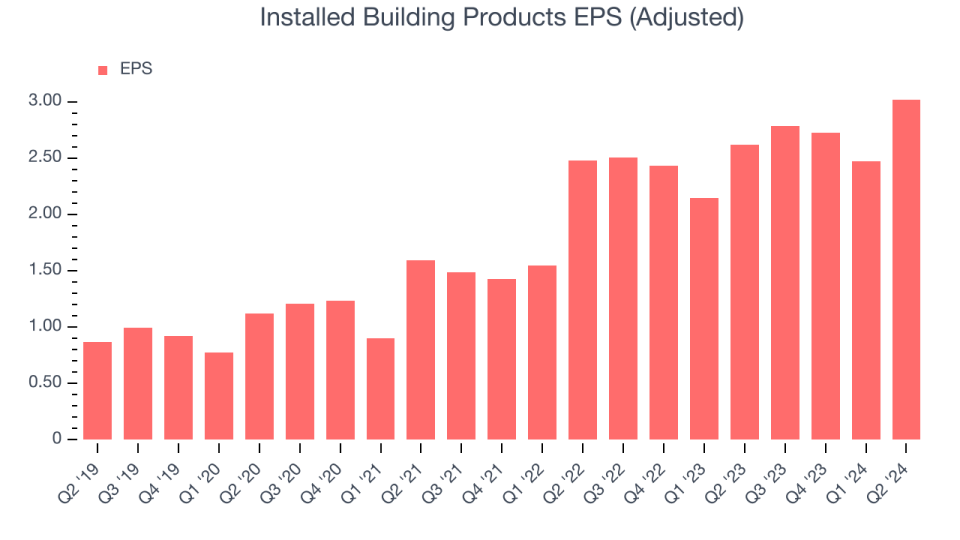
Installed Building Products's EPS grew at an astounding 31.4% compounded annual growth rate over the last five years, higher than its 15.1% annualized revenue growth. This tells us the company became more profitable as it expanded.
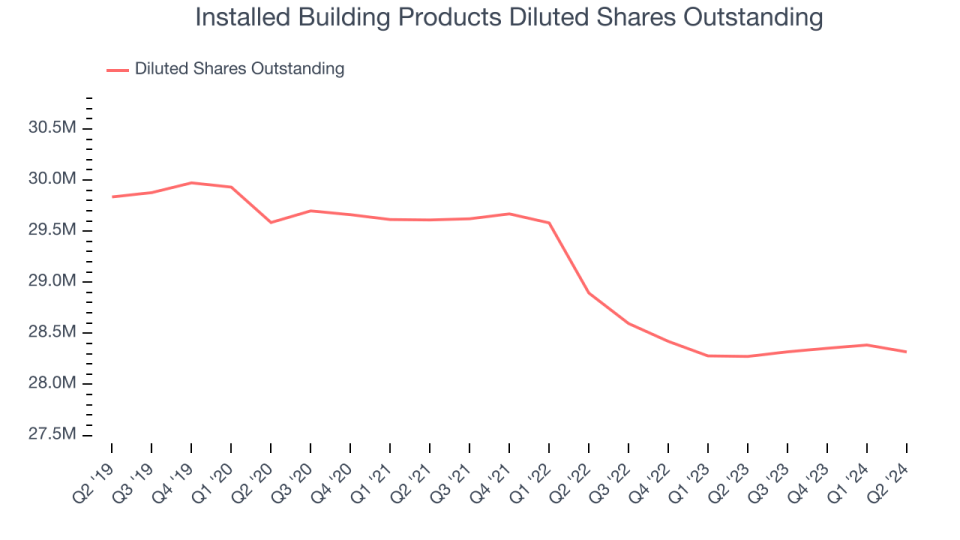
We can take a deeper look into Installed Building Products's earnings to better understand the drivers of its performance. As we mentioned earlier, Installed Building Products's operating margin was flat this quarter but expanded by 4.3 percentage points over the last five years. On top of that, its share count shrank by 5.1%. These are positive signs for shareholders because improving profitability and share buybacks turbocharge EPS growth relative to revenue growth.
Like with revenue, we also analyze EPS over a more recent period because it can give insight into an emerging theme or development for the business. For Installed Building Products, its two-year annual EPS growth of 25.9% was lower than its five-year trend. We still think its growth was good and hope it can accelerate in the future.
In Q2, Installed Building Products reported EPS at $3.02, up from $2.62 in the same quarter last year. This print beat analysts' estimates by 4.7%. Over the next 12 months, Wall Street expects Installed Building Products to grow its earnings. Analysts are projecting its EPS of $11.00 in the last year to climb by 6.9% to $11.76.
Key Takeaways from Installed Building Products's Q2 Results
Installed Building Products missed on revenue and adjusted EBITDA. Overall, this was a mediocre quarter for Installed Building Products. The stock traded down 1.1% to $267.71 immediately after reporting.
Installed Building Products may have had a tough quarter, but does that actually create an opportunity to invest right now? When making that decision, it's important to consider its valuation, business qualities, as well as what has happened in the latest quarter. We cover that in our actionable full research report which you can read here, it's free.