3 Dividend Stocks In The US Yielding Up To 9.6%
As the Dow Jones Industrial Average reaches new highs and investors eagerly await the Federal Reserve's decision on interest rate cuts, the U.S. market is presenting a mix of optimism and caution. In this dynamic environment, dividend stocks can offer a reliable income stream while potentially benefiting from favorable economic conditions. When selecting dividend stocks, it's crucial to consider their yield, stability, and growth potential—factors that are especially pertinent given current market trends.
Top 10 Dividend Stocks In The United States
Name | Dividend Yield | Dividend Rating |
Columbia Banking System (NasdaqGS:COLB) | 5.83% | ★★★★★★ |
BCB Bancorp (NasdaqGM:BCBP) | 5.11% | ★★★★★★ |
WesBanco (NasdaqGS:WSBC) | 4.64% | ★★★★★★ |
Dillard's (NYSE:DDS) | 5.97% | ★★★★★★ |
Premier Financial (NasdaqGS:PFC) | 5.06% | ★★★★★★ |
Silvercrest Asset Management Group (NasdaqGM:SAMG) | 4.87% | ★★★★★★ |
OceanFirst Financial (NasdaqGS:OCFC) | 4.50% | ★★★★★★ |
OTC Markets Group (OTCPK:OTCM) | 4.72% | ★★★★★★ |
Chevron (NYSE:CVX) | 4.59% | ★★★★★★ |
Regions Financial (NYSE:RF) | 4.48% | ★★★★★★ |
Click here to see the full list of 178 stocks from our Top US Dividend Stocks screener.
Below we spotlight a couple of our favorites from our exclusive screener.
SB Financial Group
Simply Wall St Dividend Rating: ★★★★☆☆
Overview: SB Financial Group, Inc. (NasdaqCM:SBFG) is a financial holding company for the State Bank and Trust Company, offering commercial banking and wealth management services in Ohio, Indiana, and Michigan with a market cap of $121.37 million.
Operations: SB Financial Group, Inc. generates revenue through commercial banking and wealth management services provided to individual and corporate customers in Ohio, Indiana, and Michigan.
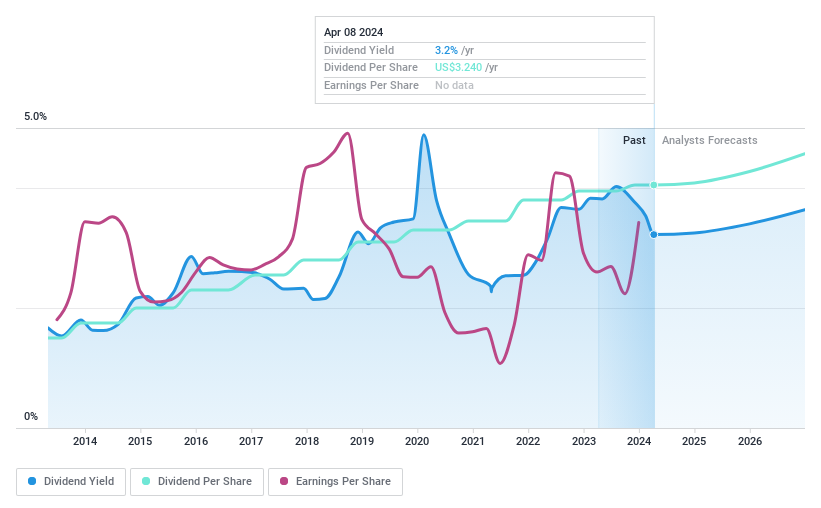
Dividend Yield: 3%
SB Financial Group offers a reliable dividend with stable payments over the past decade and a low payout ratio of 30.2%, ensuring coverage by earnings. However, its 3.02% yield is below the top quartile in the US market. Recent buybacks indicate confidence, repurchasing shares worth US$4.35 million since December 2022. Despite steady net income and EPS growth, future earnings are forecasted to decline by an average of 10.1% annually over the next three years.
Unlock comprehensive insights into our analysis of SB Financial Group stock in this dividend report.

Eastman Chemical
Simply Wall St Dividend Rating: ★★★★★☆
Overview: Eastman Chemical Company operates as a specialty materials company in the United States, China, and internationally with a market cap of approximately $12.04 billion.
Operations: Eastman Chemical Company's revenue segments include Fibers ($1.33 billion), Advanced Materials ($2.99 billion), Chemical Intermediates ($2.08 billion), and Additives & Functional Products ($2.73 billion).
Dividend Yield: 3.1%
Eastman Chemical's dividend of US$0.81 per share, payable on Oct. 7, 2024, demonstrates consistency and reliability over the past decade with stable increases. The dividends are well-covered by earnings (43% payout ratio) and cash flows (63.3% cash payout ratio). Despite a high level of debt and recent executive changes, the company maintains a solid financial position with earnings growth reported at US$230 million for Q2 2024 compared to US$272 million a year ago.
Ternium
Simply Wall St Dividend Rating: ★★★★☆☆
Overview: Ternium S.A. manufactures and distributes steel products in Mexico, the Southern Region, Brazil, and internationally, with a market cap of $6.55 billion.
Operations: Ternium S.A.'s revenue segments include $16.50 billion from the Steel Segment and $351.05 million from the Mining Segment, with a segment adjustment of $2.56 billion.
Dividend Yield: 9.7%
Ternium's dividend yield of 9.66% places it in the top 25% of US dividend payers, but its dividends have been volatile and unreliable over the past decade. The company's recent financial performance shows a net loss of US$728 million for Q2 2024 despite an increase in sales to US$4.51 billion. Additionally, Ternium faces potential indemnification liabilities from legal issues in Brazil amounting to approximately $0.8 billion.
Click here to discover the nuances of Ternium with our detailed analytical dividend report.
Our valuation report here indicates Ternium may be undervalued.

Summing It All Up
Investigate our full lineup of 178 Top US Dividend Stocks right here.
Are you invested in these stocks already? Keep abreast of every twist and turn by setting up a portfolio with Simply Wall St, where we make it simple for investors like you to stay informed and proactive.
Maximize your investment potential with Simply Wall St, the comprehensive app that offers global market insights for free.
Ready For A Different Approach?
Explore high-performing small cap companies that haven't yet garnered significant analyst attention.
Fuel your portfolio with companies showing strong growth potential, backed by optimistic outlooks both from analysts and management.
Find companies with promising cash flow potential yet trading below their fair value.
This article by Simply Wall St is general in nature. We provide commentary based on historical data and analyst forecasts only using an unbiased methodology and our articles are not intended to be financial advice. It does not constitute a recommendation to buy or sell any stock, and does not take account of your objectives, or your financial situation. We aim to bring you long-term focused analysis driven by fundamental data. Note that our analysis may not factor in the latest price-sensitive company announcements or qualitative material. Simply Wall St has no position in any stocks mentioned.
Companies discussed in this article include NasdaqCM:SBFG NYSE:EMN and NYSE:TX.
Have feedback on this article? Concerned about the content? Get in touch with us directly. Alternatively, email editorial-team@simplywallst.com